Market analysis is temporary and always prone to changes. Markets alter due to policy, politics, geopolitics, Fed activity, the economy, etc. Therefore, before making a transaction, please thoroughly consult your financial advisor.
Mid-Term prediction analysis: Year 2022-2023
Prediction 1: (10% chance) The $20,000 Bitcoin price is already at the bottom, and next year will be bullish. Our Strategy: Utilize no more than 10% of the cryptocurrency budget.
Prediction 2: (50% chance) BTC will fluctuate between $11,000 to $20,000 Our Strategy: Utilize no more than 60% of the cryptocurrency budget.
Prediction 3: (40% chance) BTC will hit below $11,000 Gradually use 100% of the cryptocurrency budget.
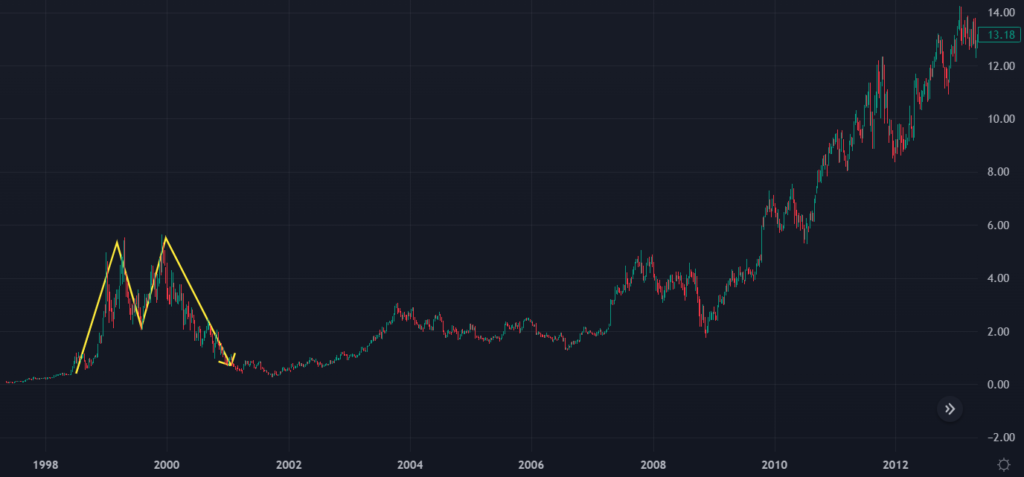
This is an example of an Amazon stock. It forms the M pattern during a dot.com bubble. Only what we observe on Bitcoin charts, it took ten years to recover. What we analyze today has some similarities to the dot.com bubble.
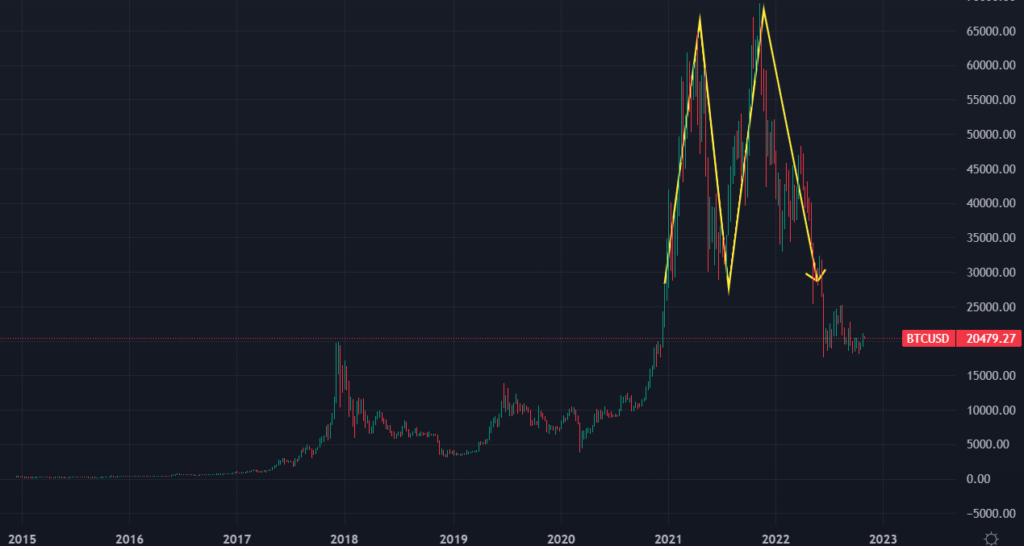
This is a Bitcoin chart and the same M pattern. Although we cannot compare Amazon (tech stock) with Bitcoin (blockchain technology), investing is about being prepared to pay whatever it takes in case the worst-case scenario occurs.
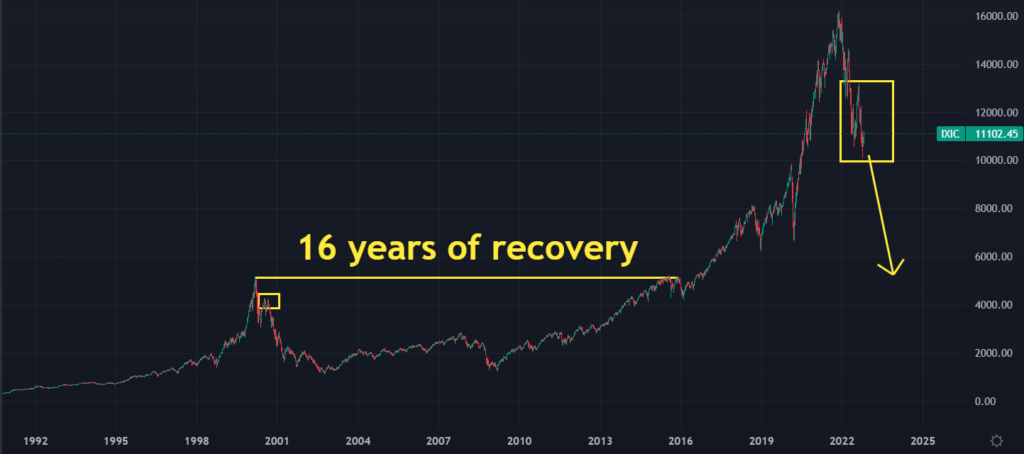
Here is the example of the NASDAQ stock exchange. The yellow square on the NASDAQ today resembled the last dot.com bust in 2000. We are choosing the NASDAQ as an example because, according to our analysis, the NASDAQ and cryptocurrency usually have some connection.
Nobody possesses a crystal ball, and we hope this is incorrect. However, investing in a bear market is all about being defensive, we must prepare for the worst-case situation. The best trader in the world does not wait for the real bottom because the market will never hit our bottom expectation, and then it will rebound.